HOW TO MAKE A Piktochart is a web-based infographic application which allows users without intensive experience as graphic designers to easily create professional-grade infographics using themed templates. 1. Choose a template Your first step would be to select the most proper infographic format: poster, presentation, report or infographic. Secondly you should choose one from free templates.Continue reading
Author Archives: madeltupaz0
Instructional Software for Classroom Use
1. COMPUTERS CAN INCREASE PRODUCTIVITY 2. COMPUTERS FACILITATE COMMUNICATION BETWEEN STUDENTS, TEACHERS, AND ADMINISTRATORS. 3. COMPUTERS ARE USED TO ACCESS 4AMOUNTS OF INFORMATION. Development has been a major quest of people’s lives for quite some time. Technological developments have influenced all sectors of our lives including communication, transportation, health and education. It has caused significantContinue reading
1. It conserve multiple teaching function. *Drill and Practice *Access information 2. It can be used in different teaching and learning modes. *classroom interactive learning *independent learning *network learning *organization leaning *manage learning 3. Information can be delivered in an instant. *instant messaging *text messaging *google messages
1650- The Horn Book: a wooden puddle with printed lessons. 1820- Difference Engine: by Charles Babbage, use in calculating and printing a simple math tables. 1830- Analytical Engine: second computing machine which was used in calculating complicated problems by the following of instruction. 1870- Magic Lantern: the primitive version of slide projector that projected imagesContinue reading
Healthy Weeknight Meals
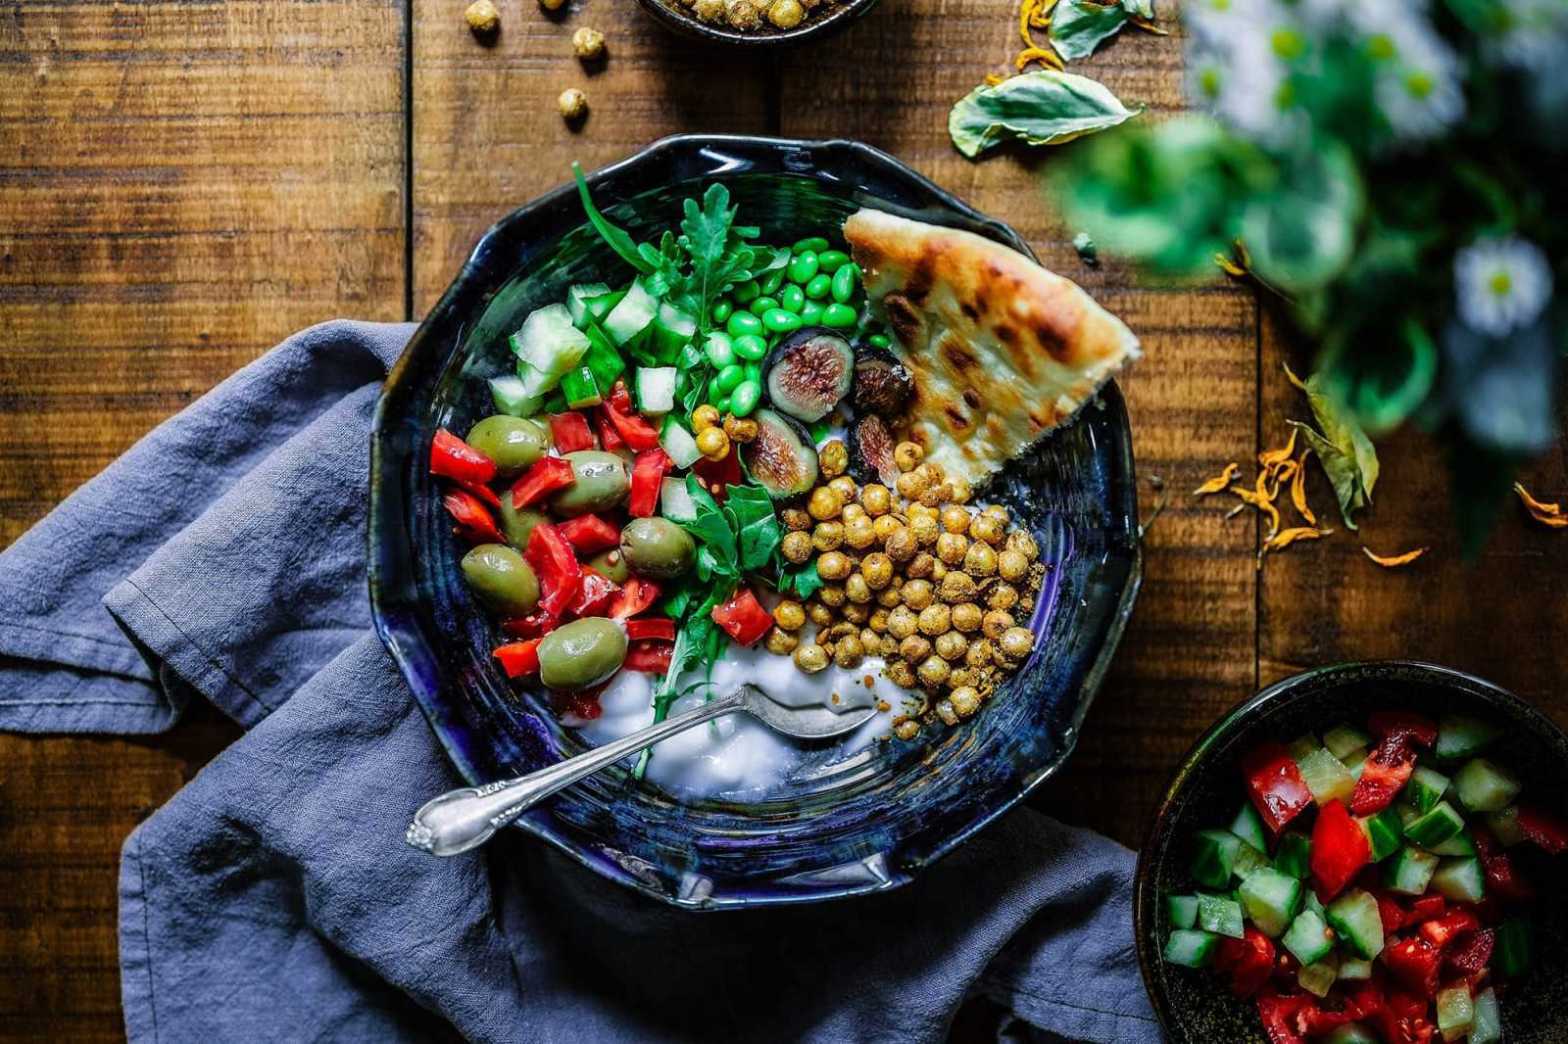
Cooking can sometimes feel like a chore at the end of a busy day. It’s often tempting to throw a ready meal in the oven or call for take out. But preparing a simple and healthy family meal doesn’t have to be hard or time-consuming. Here are some quick wholesome dishes that you and yourContinue reading “Healthy Weeknight Meals”
Better than Poutine
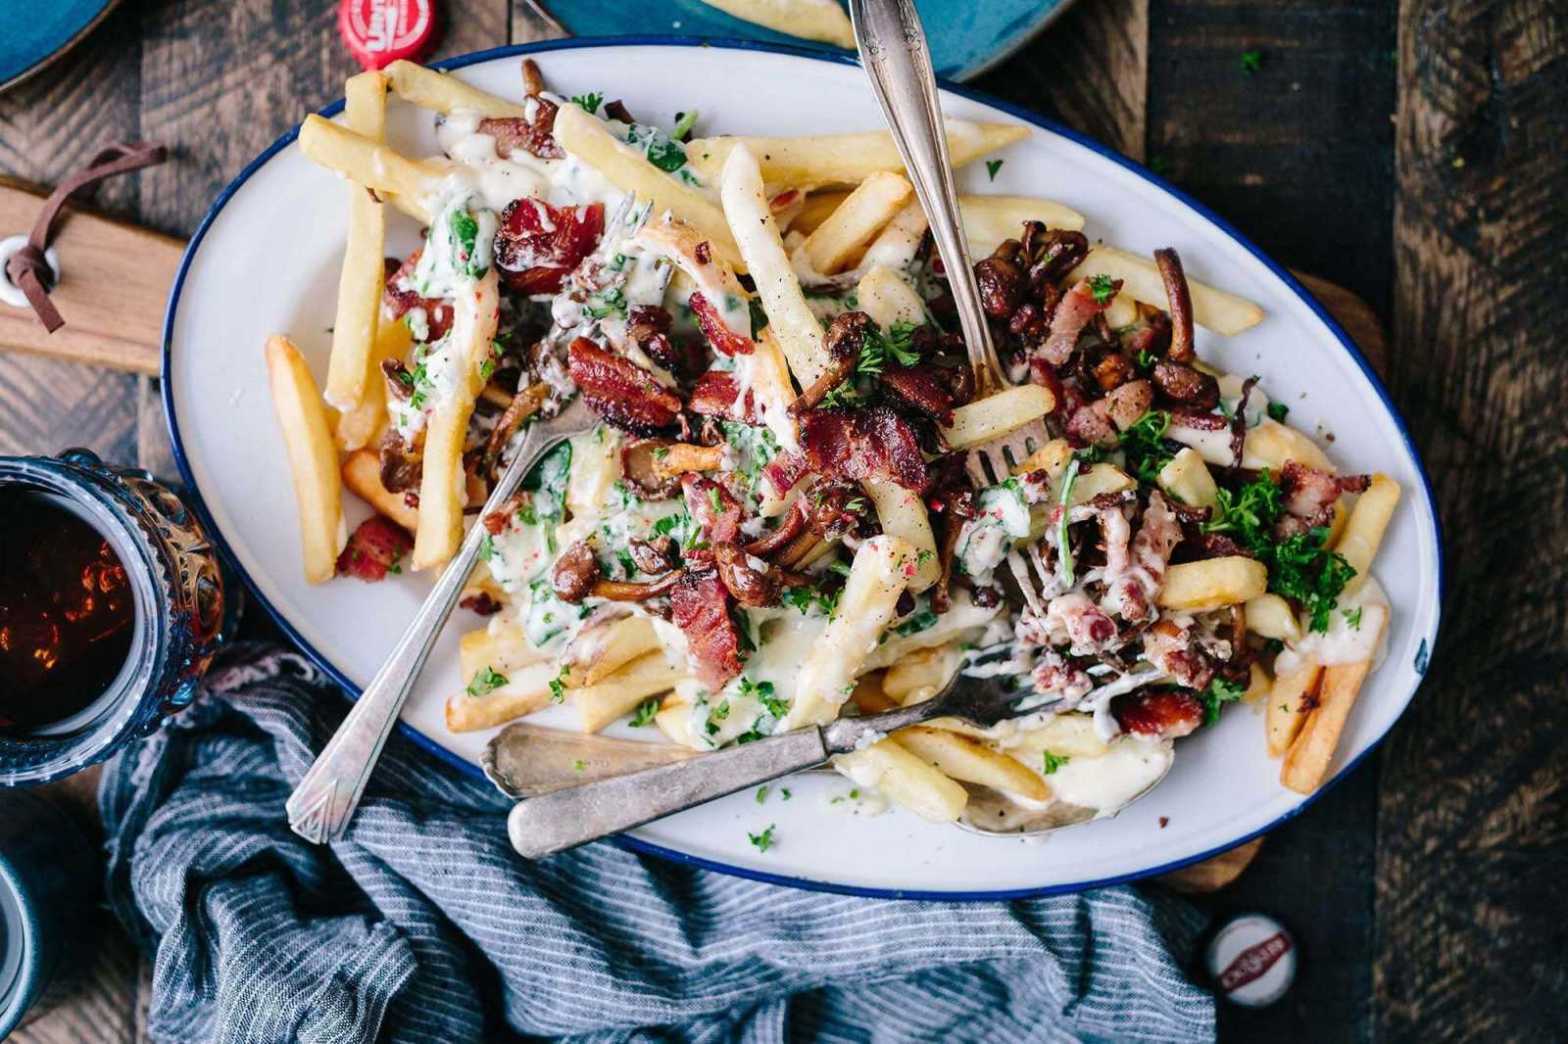
I know, what could be better that a steaming plate of fries, gravy and cheese curd? Fries, gravy, cheese curd and bacon, that’s what! Throw in some fresh shallots, chilli, and a splash of roasted bone marrow and duck gravy, and we turn this popular French-Canadian dish into a something sublime.
Breakfast at my House
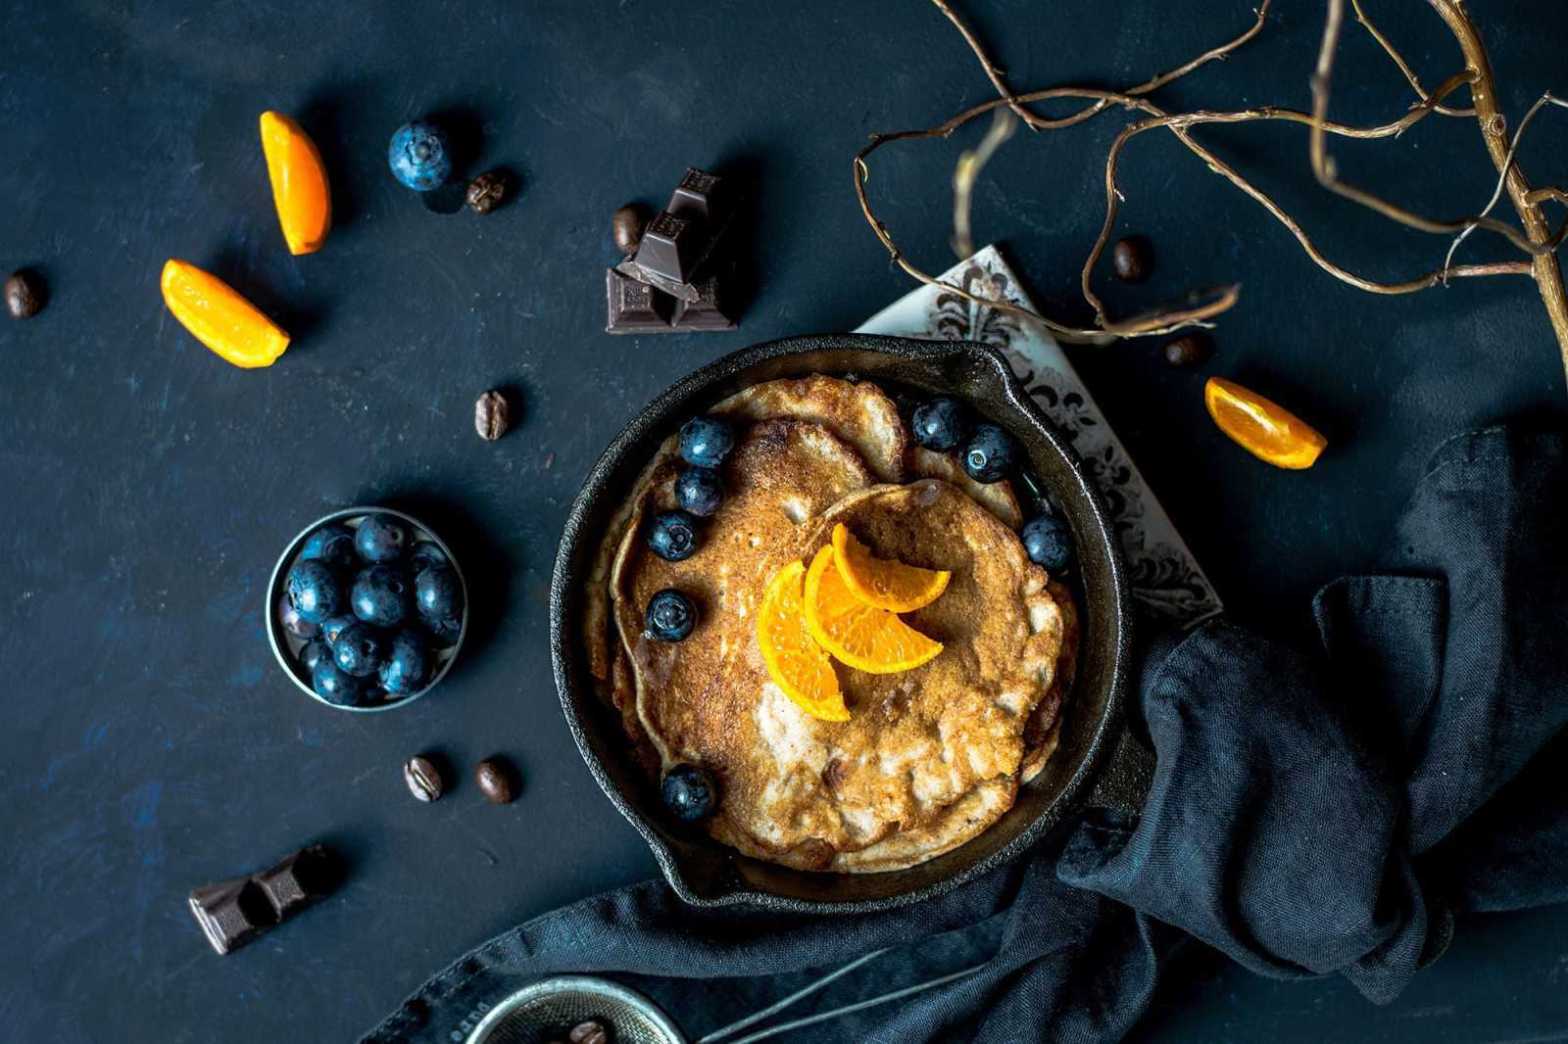
During the week we’re often walking out the door with a coffee in one hand and slice of toast in the other, but on weekends breakfast is never rushed. It’s a late affair, sometimes spilling over to lunch, with lots of reading and chatter in between courses of fruits, poached eggs, honey and toast. OneContinue reading “Breakfast at my House”
Roasted Pumpkin Soup
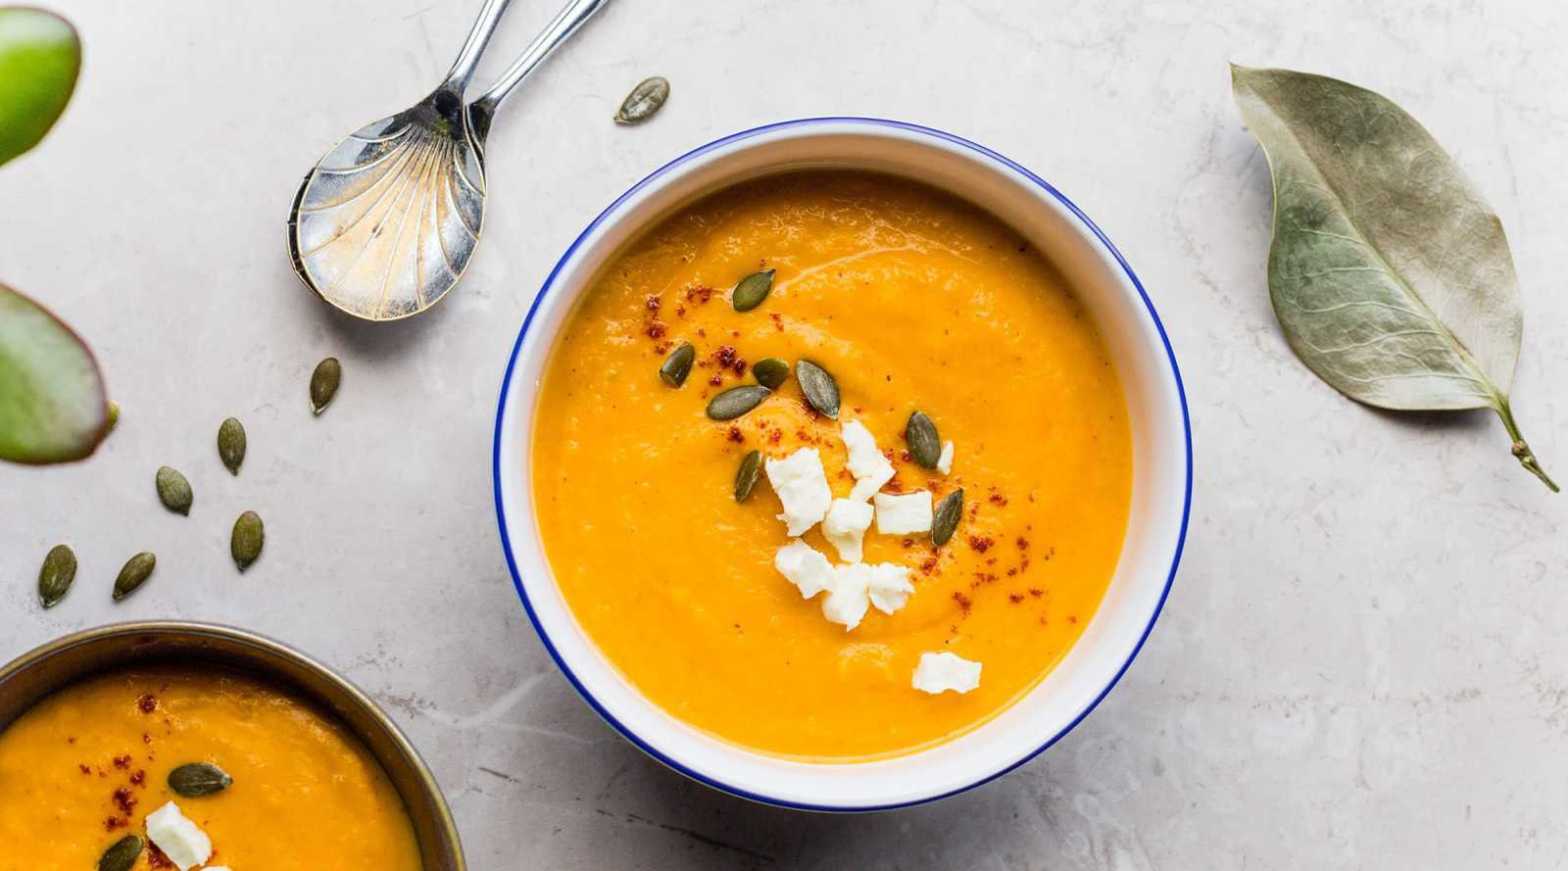
There’s nothing better than a warm bowl of pumpkin soup on a cold autumn day. Combine your roasted pumpkin with some onion, garlic, vegetable broth, and a few spices, and give it some time to simmer away. Pair it with a few slices of fresh bread to turn it into something sublime.
